We were proud to be part of the UK Walking Summit last week in Bristol’s City Hall, a conference organised by Living Streets, in partnership with Bristol City Council.
We heard from speakers, including Catherine Woodhead, CEO of Living Streets, who shared impressive statistics showing that walking for leisure across the UK has increased by 6.8% to over 3 million adults, and that their 2024-25 walk to school project resulted in an 8% shift to walking all the way. Cllr Ed Plowden, Chair of Transport and Connectivity Committee in Bristol, outlined ambitious targets to reduce car journeys from 51% to 20% by 2030. Dr Scarlett McNally, a surgeon and BMJ columnist, shared a body of evidence that 150 minutes a week of physical activity provides significant health benefits, and most interestingly, that you can get the same health benefits from using an electric bike as a traditional bike, as you’re more likely to use it!
There were fascinating panel discussions and chats over tea and coffee about how good design examples should get fed back into future planning, tactical urbanism, the importance of impact evaluation, and qualitative research on why walking experience helps with wellbeing, allowing people to reflect, solve life problems and to daydream.
We were invited to host one of the lunchtime walks, and we chose to conduct an experiment related to our Airmap product, to understand just how much our perceptions of environmental quality can be a barrier to active travel. Our hypothesis was simple: offering people journeys with better perceived environmental quality would increase walking, cycling, and wheeling. But is it the case?
The Experiment
We designed a loop route with two distinct halves – Route A with poor environmental quality and Route B with enhanced green, views of the River Avon, pedestrianised areas and less noise and pollution. Participants completed surveys at three points: before the walk, after the first (poor quality) route section, and after the second (enhanced) route section. We measured changes in mood, stress levels, and crucially, willingness to choose active travel for each route type.
The walk started at College Green and deliberately contrasted a typical urban route on Anchor Road (with traffic noise, limited greenery, and air pollution) against Bristol’s enhanced green corridors featuring tree-lined paths, reduced traffic exposure, and improved air quality. We explained how our Airmap technology, developed with Southampton City Council and Go Jauntly, maps environmental quality across cities by combining factors like noise levels, air pollution data, and green infrastructure quality.
Route A – Anchor Road
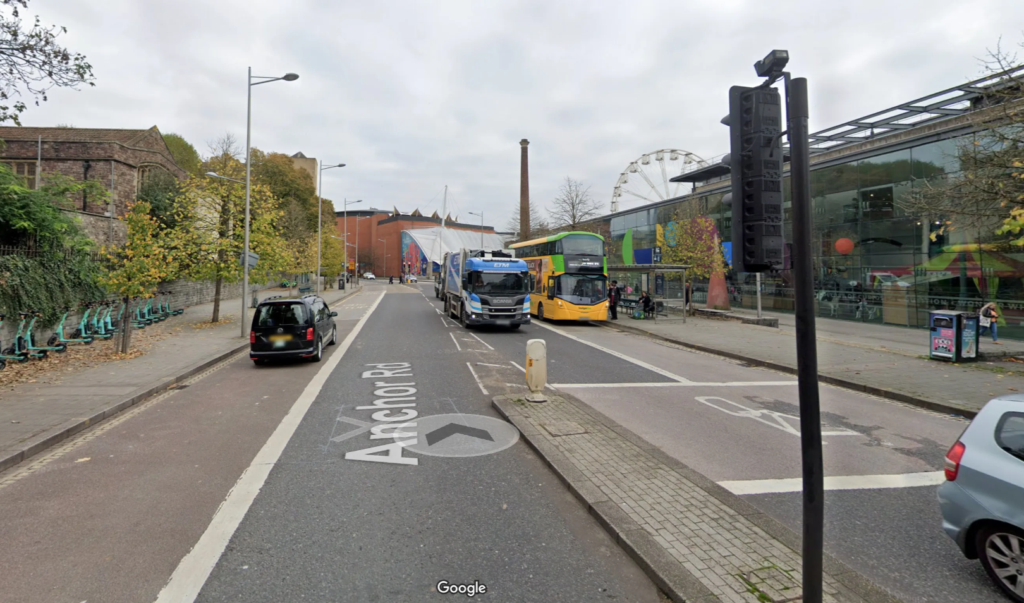
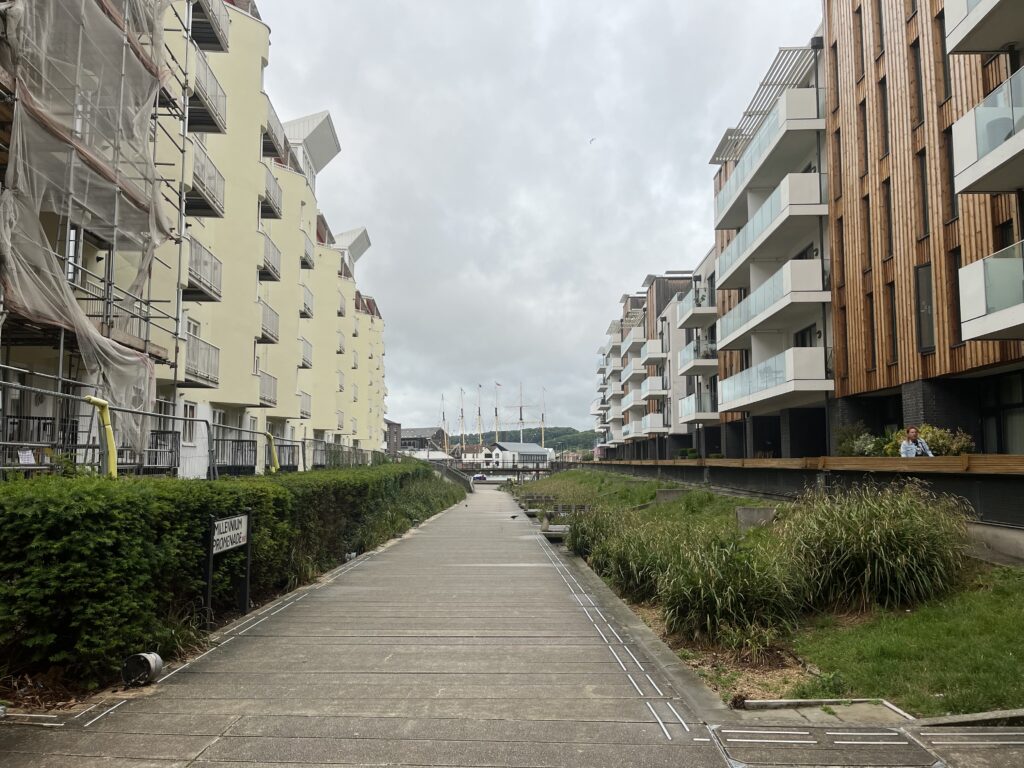
Image 1: Millennium Promenade in Bristol (Image: Tranquil City Ltd) – First section of Route B, with greenery, seating, river views and traffic-free.
Route B – Millennium Promenade, Hannover Quay & Cathedral Walk
Image 2: Millennium Promenade in Bristol (Image: Tranquil City Ltd) – First section of Route B, with greenery, seating, river views and traffic-free.
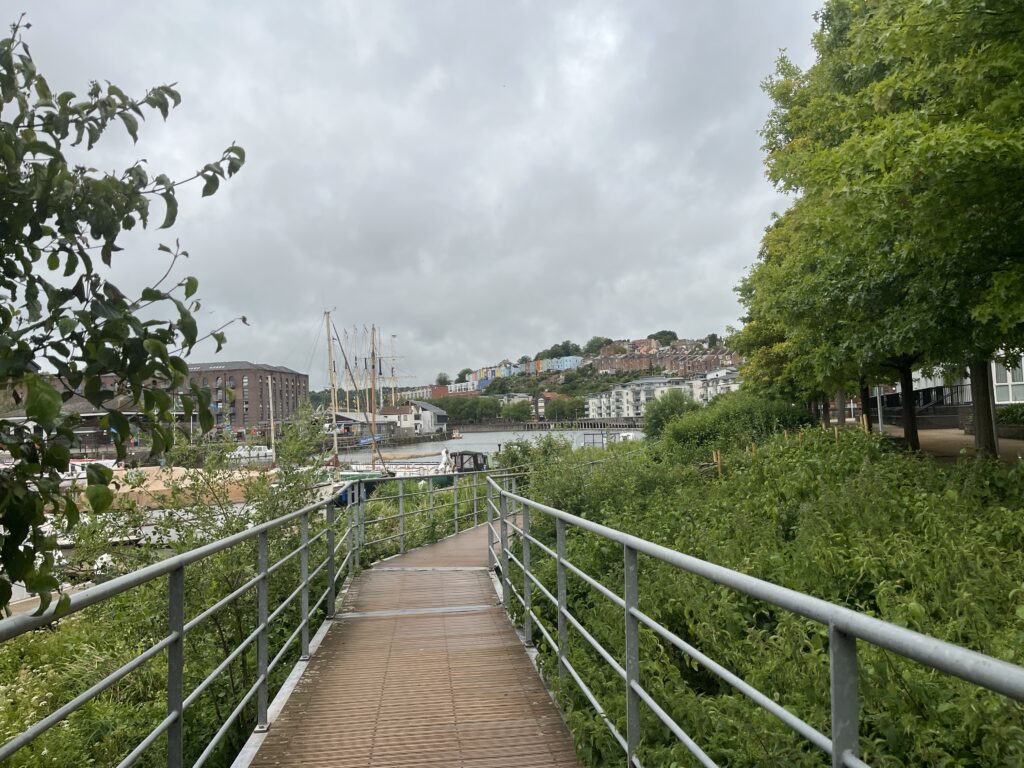
Image 3: Hannover Quay in Bristol (Image: Tranquil City Ltd) – Second section of Route B, a riverbank boardwalk with lush greenery on either side.
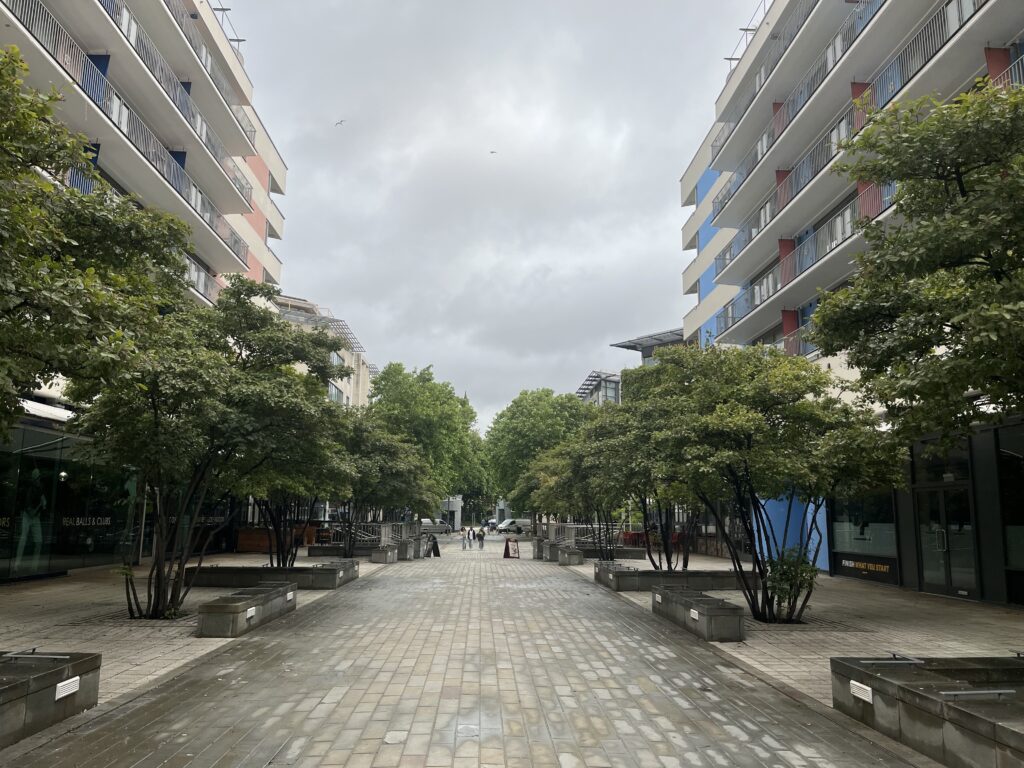
Image 4: Cathedral Walk in Bristol (Image: Tranquil City Ltd) – Last section of Route B, a tree-lined pedestrianised street with outdoor seating, and cafes and restaurants.
A total of 8 participants attended the walk and took part in the survey. During the walk, we shared key research findings that informed our approach. Natural England research showed that connectivity and street-level greenery are crucial for encouraging active travel, whilst our research for Defra found that just the visual presence of greenery can reduce perceived road traffic noise by 10dB – effectively halving the perceived sound level.
We also highlighted Bristol’s progress on air quality: NO2 levels dropped 25% between 2019-2023, with 2023 levels showing a 13% reduction from 2022 and PM2.5 levels down 30% year-on-year. However, we noted that while most locations now meet Defra guidelines, none yet meet the more stringent WHO targets introduced in 2021.
Why This Matters
The Transport Analysis Guidance (TAG) recognises journey quality as a key factor in active mode appraisals, breaking it down into Traveller Care (cleanliness, information, environmental quality), Traveller Views (pleasantness of surroundings), and Traveller Stress (frustration, fear, route uncertainty) (TAG Unit A4.1). Yet there’s limited evidence on how environmental quality specifically affects travel choices and how you would go about measuring that effect. This is exactly what we’re building evidence for.
Our mission at Tranquil City is to get more people in cities in contact with nature and healthier spaces to boost wellbeing, because cities are growing, and we need to learn how to live well within them. The Airmap solution represents a practical application of this research, helping people find A-to-B routes via the most tranquil, green, and least polluted paths.
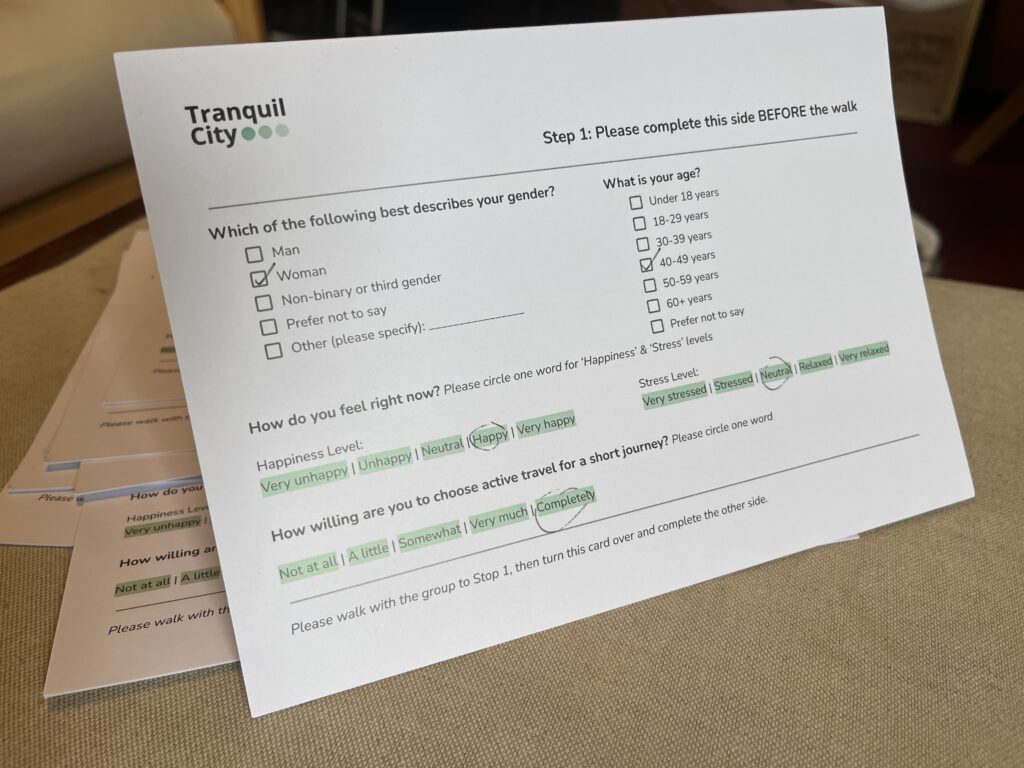
Image 5: Survey forms were completed by the participants to capture both quantitative and qualitative information.
What did we find?
The experiment found:
- Participants rated the perceived environmental quality of Anchor Road (Route A) as ‘Poor’, with a mean score of 2.4 out of 5. Environmental quality was described as perceptions of soundscape, air quality, cleanliness and presence of green infrastructure.
- Participants felt less happy when walking along Anchor Road (Route A), with mean happiness scores dropping by 6% when compared to baseline scores.
- Participants felt more tense when walking along Anchor Road (Route A), with mean relaxation scores dropping by 19% when compared to baseline scores.
- Average perceived environmental quality increased to ‘Very Good’ (4.5) on Route B. This shows that Route B was perceived to be better in terms of aspects such as air quality, soundscape and presence of green infrastructure.
- After walking Route B, participants’ happiness went up, with mean happiness scores increasing by 17% after walking Route B, compared to at the end of Route A.
- Participants felt more relaxed after walking Route B, with mean relaxation scores increased by 28% after walking Route B, compared to at the end of Route A.
- When asked to share three words to describe each of the routes, Route A (Anchor Road): enclosed, unpleasant, loud, traffic dominated, honking, unsafe, dusty. Route B: Scenic, fresh air, varied, cooler, peaceful, interesting, green, calm, quieter, leaves rustling
- Overall, participants’ willingness to travel actively along Route A was 22% lower than the baseline before the start of the walk, whereas after walking Route B, their willingness to travel actively increased by 3% compared to the same baseline.
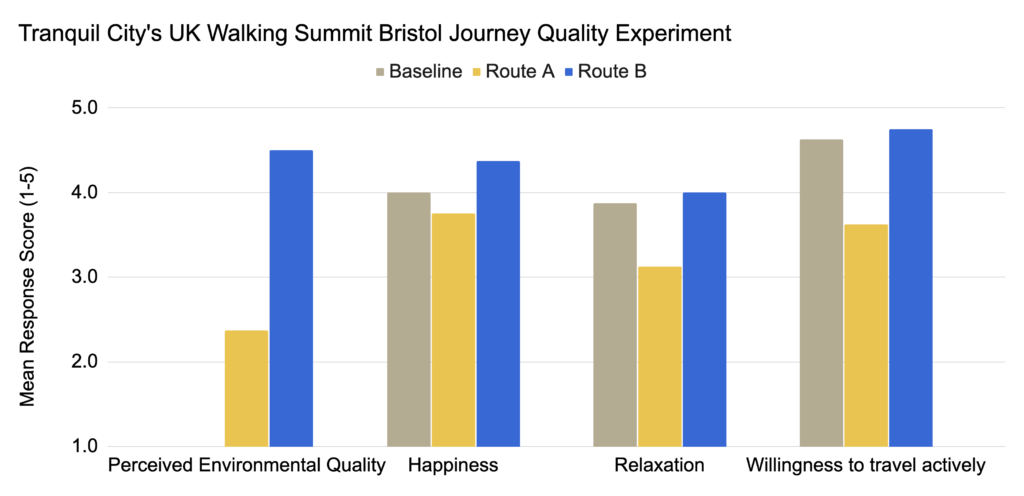
Chart 1: Results of the survey exploring how our perceptions of environmental quality affect mood and willingness to travel actively.
The results are an indication of how poor environmental quality, and our perception of it, can discourage walking and cycling and negatively affect our mood and make us feel more tense.
It also points out the importance of providing positive street environments that are less traffic dominated, quieter and greener, as a way to support positive wellbeing and achieve the government’s target of reaching 50% of all urban journeys to be walked, cycled or wheeled by 2030.
The response from summit attendees was encouraging, with multiple follow-up meetings already scheduled to explore collaborations and future Airmap implementations across the UK. Thank you to Zak Viney & Sally Fixter MCIOF(AdvDip) for their help and support in running the walk.
If you’re interested in bringing Airmap to your city to promote and measure the impact of improved journey quality on active travel uptake, I’d love to hear from you.
Grant Lewis Waters – CEO at Tranquil City